

Pivot Trendline Breaks — reading the sloped lines and the 'B' markers
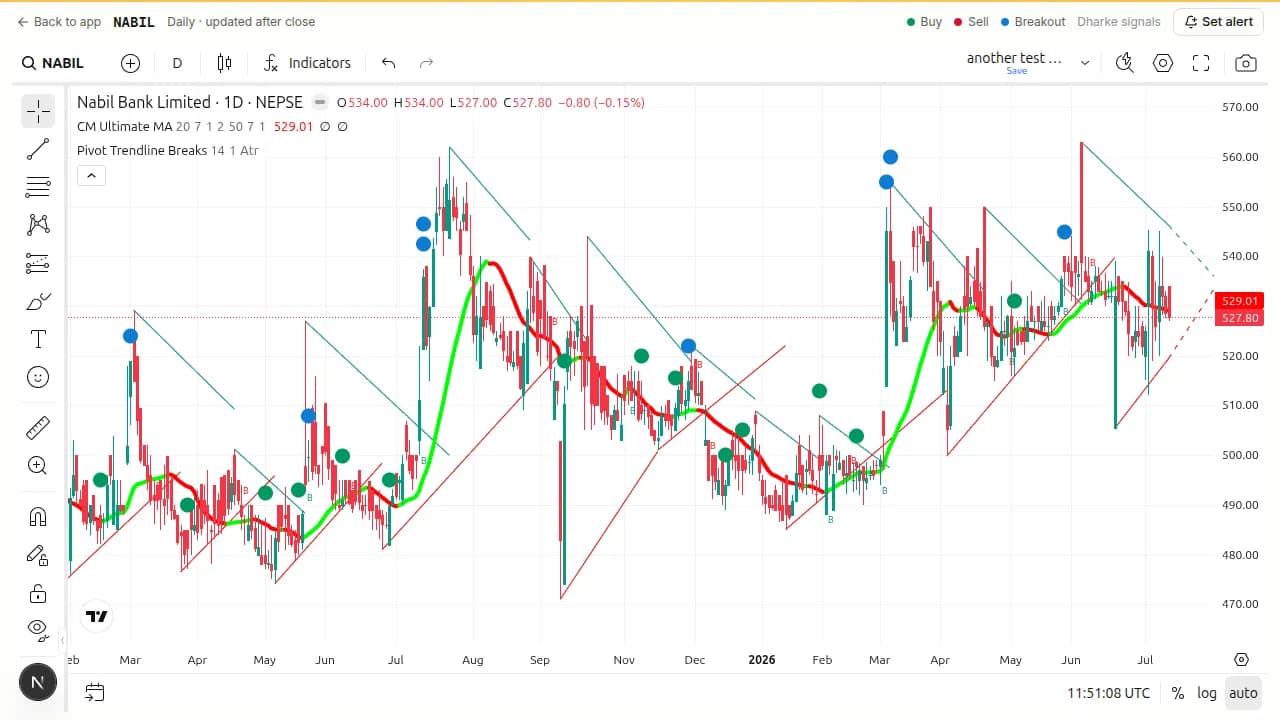
Two auto-drawn trendlines and a break marker: the teal line tracks the falling highs, the red line the rising lows, and a 'B' prints the bar a close punches through.
Enable it from the chart’s fx Indicators dialog as “Pivot Trendline Breaks”.
Read it in 30 seconds
- The TEAL line is anchored to swing HIGHS and slopes down — a descending resistance. The RED line is anchored to swing LOWS and slopes up — an ascending support.
- Each line re-anchors at every new swing pivot, so it always tracks the most recent structure; the dashed part is just the current line projected forward.
- A 'B' marker prints only when a CLOSE punches through the line: a teal 'B' (at the bar's low) = a close broke above the teal resistance; a red 'B' (at the bar's high) = a close broke below the red support.
- A break is a heads-up that the trend line gave way — it is context, never a standalone buy/sell.
What each element means
- Teal trendline (falling highs)Actionable
Anchored to the latest swing high and sloped down by a volatility-scaled amount. Acts as a descending resistance until a close breaks above it.
- Red trendline (rising lows)Actionable
Anchored to the latest swing low and sloped up. Acts as an ascending support until a close breaks below it.
- Teal 'B' — upward breakActionable
A candle CLOSED above the teal trendline (drawn at that bar's low). The falling-highs resistance was broken to the upside. Fires once per line.
- Red 'B' — downward breakActionable
A candle CLOSED below the red trendline (drawn at that bar's high). The rising-lows support was broken to the downside. Fires once per line.
- Dashed extensionInformational
The current trendline projected to the right at its current slope — where the line sits on upcoming bars. Same line, just extended; context only.
Swatches show the indicator’s default colors. If you’ve recolored it (or switched to Monochrome), your chart will differ.
What it tells you
- Where the most recent swing structure draws a diagonal resistance (teal) and support (red), auto-updated at each new pivot.
- The exact bar a close broke through that diagonal — the 'B' marker — which often precedes a short-term momentum shift.
- How steep the prevailing move is: a steeper slope comes from higher volatility over the lookback.
What it does not tell you
- A 'B' break is not a buy/sell signal — it marks that a line broke, not that a trade is on.
- The lines are not horizontal support/resistance; they slope, and they re-anchor at every new pivot.
- It does not deliver an off-chart alert — the break is drawn on the chart only, nothing is sent anywhere.
- A break can fail immediately (a close back through the line) — one 'B' is not confirmation of a new trend.
Common misreads
- Reading a teal 'B' as 'buy' — it means a close crossed the teal line, and the color just matches the line it broke, not a direction to trade.
- Treating the sloped line as a fixed price level — it moves every bar and jumps when a new pivot forms.
- Expecting a notification when a break happens — v1 draws the 'B' on the chart and does not alert.
- Assuming the dashed extension is a separate line or a forecast — it is the same trendline drawn forward.
Worked examples
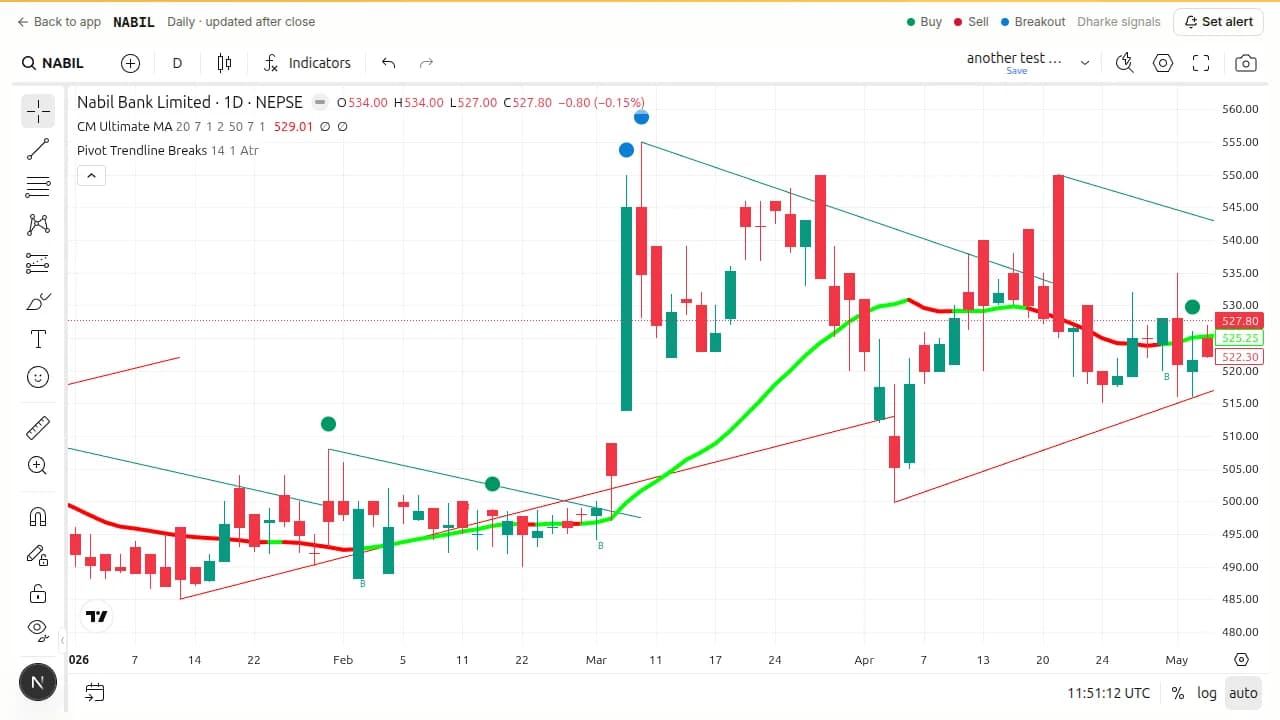
Price ground under a teal down-trendline of lower highs for weeks; the bar that closed above it printed a teal 'B', and the rally followed. The break led, the line stopped re-drawing against price.
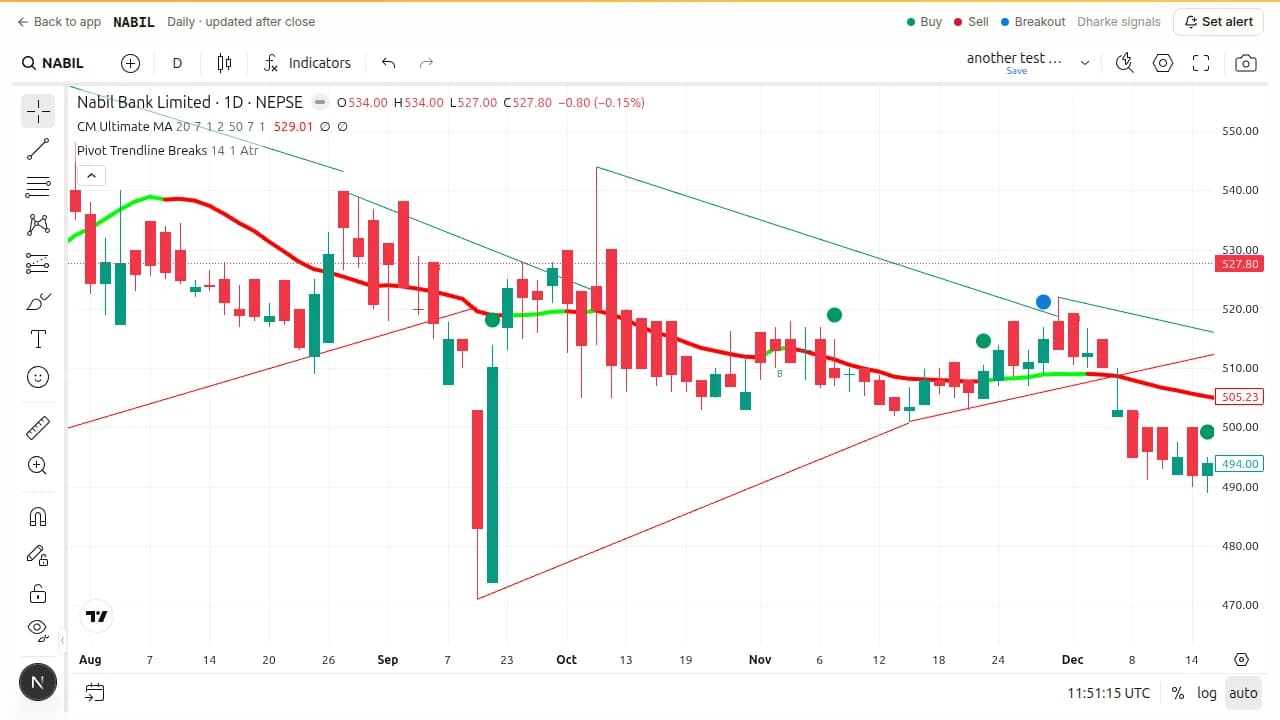
In a sideways range the lines re-anchored constantly and 'B' markers printed both ways within a few bars each, none holding. Frequent breaks with no trend are noise, not setups.
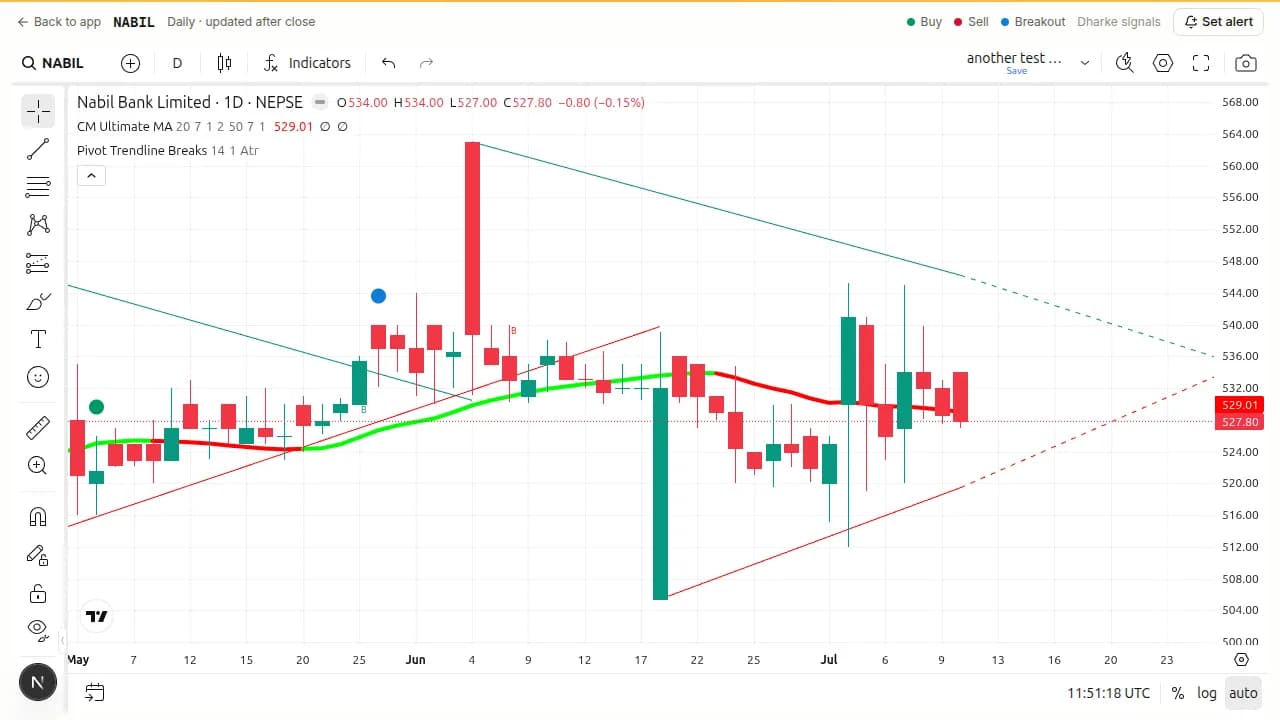
A teal 'B' fired, but the very next close fell back under the line and the down-trend resumed. A single break with no continuation is a failed break, not a reversal.
Not financial advice. For research and education only.